Salesforce Obscura: Nonprofit Data Pipeline On the Cheap (Part 1)
Data on a budget? We’ve got some duct tape for that!
Salesforce reporting is amazing until it isn’t
There comes a time in every nonprofit’s Salesforce journey where you encounter The Dreaded Hinge Problem (tm). I have named it this because your data model looks like a door hinge — two child objects linked together by the same parent.
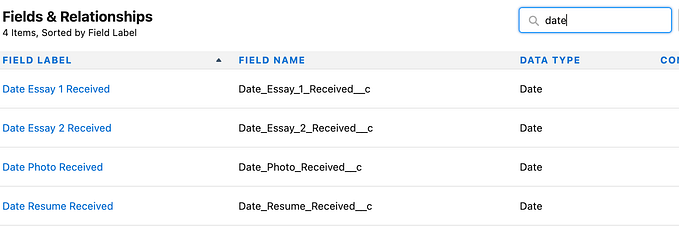
Let’s say you keep participant data in Contacts, you track their program participation in a custom Program object, and you track their employment engagement in Affiliations. You also track their engagement in program-related events in Campaign Member records.

If you need to ask how many participants took part in a specific campaign — easy. That’s a Campaign with Contacts report.
If you need to ask how many participants started a job with a particular company during a particular timeframe — easy. That’s an Affiliations report.
If you need to ask how many participants started or completed your program in a given timeframe — easy. That’s a Program and Contact report.
If you need to know, of the participants who started your program last year, how many participated in a specific event? A little less easy but that’s a cross-filter report most likely.
But if you need to know, of those same participants, which events did they participate in while in the program and who wound up with a job at a specific employer, with details from both objects? Yeah, not so much.
Sometimes you need SQL. Sorry, not sorry.
Salesforce is awesome at simple list building but doesn’t provide a true query tool (aside from actual programming), and without a true query tool you can’t specify exactly how to join these lists of different lengths together.
Before you start with your suggestions — I have spent over a decade engineering Salesforce-native solutions to this problem. At Deep Why we love DLRS — we don’t really deploy without it anymore and if I ever meet Andy all the the rounds are on me. I am perfectly well aware of Reporting Snapshots and use them when I need to. I am also perfectly well aware of every single method of using Salesforce reports and all the available tools in the Salesforce toolkit to tackle this. Yes, I know there are paid 3rd party solutions.
And because I have an enterprise data systems background, frankly I’m just tired of adding technical debt or relatively high cost to a powerful solution just to get ad-hoc reports. All of those solutions work when your intended data set is stable and predictable — but tell me honestly how many times you just need something for a funder that is totally out of left field?
Sometimes you truly need a real warehouse/lake/whatever solution like my friends at Inciter can provide. Sometimes you just need some targeted automations and data architecture skills to put your data at your fingertips using all Salesforce native tools.
And sometimes you’re stuck in the middle, where you really just need a few giant datasets to cover 90% of every question anybody ever asks, but it’s not possible with your architecture and a more costly solution isn’t warranted.
Here’s what we’re doing for those situations, in hopes it helps others.
A low-cost and simple data pipeline

We use:
- Salesforce for data capture — even in very complex architectures — and all reporting and dashboarding
- Skyvia to ship data wholesale at low cost (about $85/mo*) into a…
- …Microsoft Azure SQLServer database set to the lowest cost tier (about $15/mo) to set up views and large flat aggregation tables
- Using Microsoft Automations to run nightly queries that transform the raw data into the aggregation tables (can be free if you optimize to less than 500 minutes of runtime per month)
- Then back to Skyvia to ship the data back into a big flat object in SF for super easy reporting
- We also use Google Data Studio for dashboards and visualizations when needed, being sure to expose only anonymized/aggregated data
*Skyvia is volume based and this price assumes an annual rather than monthly subscription. Our very large clients need to step up from the $79/mo to $399/mo data subscription, but our very large clients would be paying a LOT more for a different stack and are served really well with this.
Total annual cost is whatever Salesforce costs you plus less than $2k / year if you have fewer than 500,000 records transferring around per month, which is totally doable if you use the incremental replication functionality.
We are not partners with** or receiving any money from any of these tools. We are consultants who get to play with a bunch of different tools while doing our work, so have hands-on experience with what it really takes and what it really costs for a range of options. From that expertise we have found this toolkit works really well and have seen that the actual costs are affordable, so that’s where we’re coming from.
** Deep Why’s sister company HCA is a Salesforce ISV partner, in the interest of transparency.
What’s in this series?
It took us awhile to figure out the right set of tools to get this done at a reasonably affordable price, and of course if you don’t have in-house SQL expertise you will have to add some consulting dollars to your budget. We’re hoping that this helps folks who are looking for an affordable solution for those tricky “in between” situations — we learned it and are happy to share it with everybody in case it’s useful.
You should read these in the order listed below.
- Overview — this article, which introduces the series and outlines our example use case
- Salesforce and the data visualization ecosystem — when do you need to consider something other than Salesforce for reporting?
- Setting up SQLServer as a “good enough” Data Warehouse — the steps to set up SQLServer in an Azure environment to meet the requirements of being “good enough” for this use case
- Setting up Skyvia to replicate your Salesforce data into SQLServer — the steps to use Skyvia to pull data from Salesforce into SQLServer on a regular basis
- Transforming data inside your SQLServer for visualization — the overview of why you’d have data in SQLServer in the first place, what your automation options are, and how you might use this thinking to support visualizations
At each step we’ll talk about who typically owns or should be participating in this work and considerations for executing on each step, but we won’t be providing actual SQL examples for transformation since that depends on your unique situation.
FAIR WARNING: YOU GET WHAT YOU PAY FOR WHENEVER DATA IS CONCERNED. Analysis on the cheap is going to be bad analysis and the more powerful the toolkits the more that can go wrong. I am focusing only on building an affordable data pipeline and storage solution, which are things that are likely in reach for a sufficiently technical Salesforce administrator.
If you read this series and feel despair at executing on this stuff yourself, reach out. We at Deep Why focus on making your Salesforce ecosystem work really well, which can include getting it into an Azure data warehouse. Our friends at Inciter specialize in helping you understand your data and making all of your reporting needs seamless and easy. We often work together, so if you’re not sure just shout and we’ll get you to the right team.